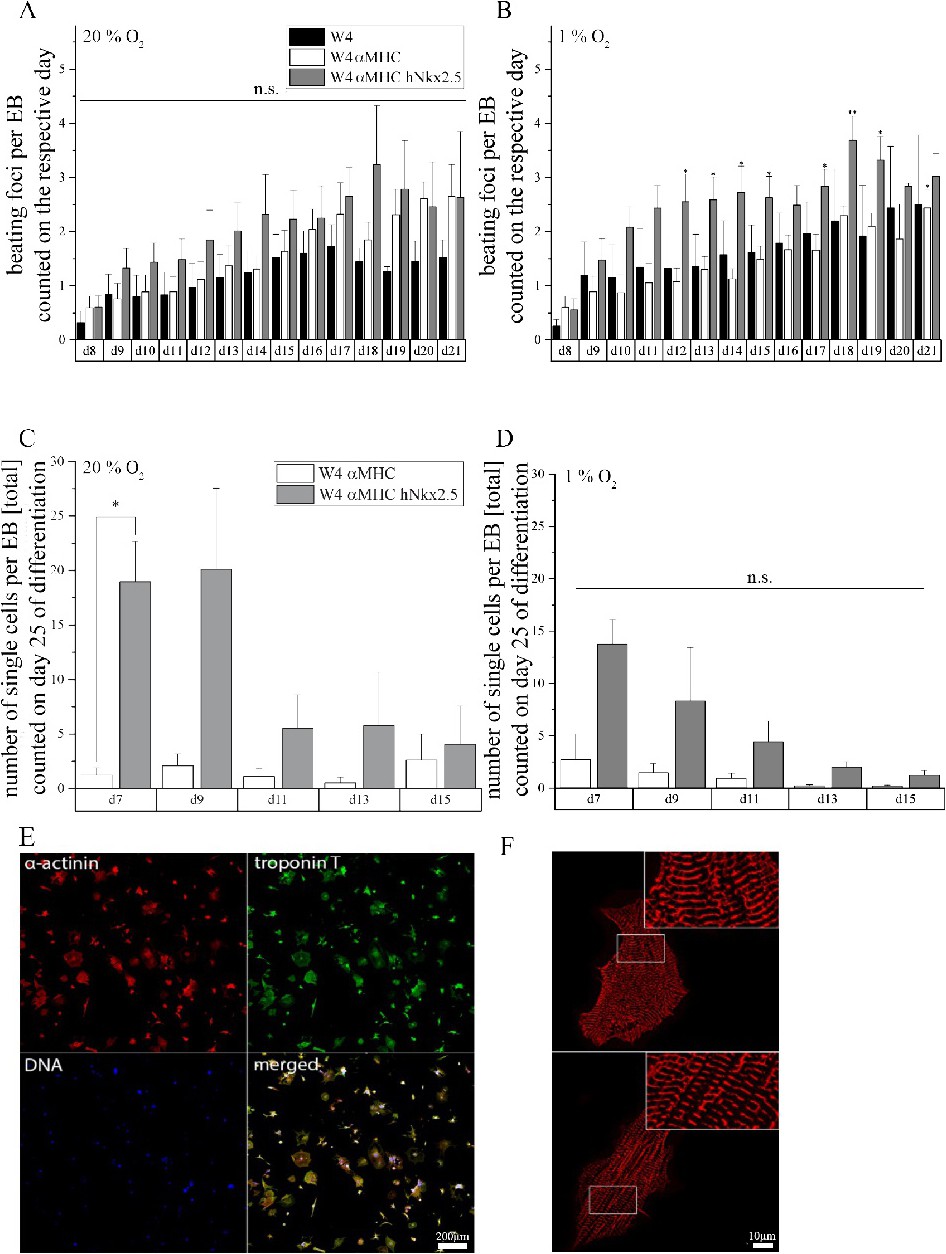
Fig. 2. Optimization process during cardiogenic differentiation: Quantitative determination of spontaneously beating areas per EB (n=7 (d8-d17), n=3 (d18-d21)) under 20 % O2 (A) and 1 % O2 oxygen conditions. Quantitative determination of the optimal time point to initiate antibiotic αMHC-selection with respect to maximum cell yields under 20 % O2 (C) and 1 % O2 oxygen conditions (D); therefore cells were treated on different time points with puromycin and single cell number was subsequently determined at day 25 of differentiation (n=3). Values are presented as mean ± SEM; statistics were performed as multiple comparison of mean within one specimen to compare time points - no significance calculated; and t-test to compare both specimen within one time point; *p ≤ 0.05. (E, F) Immunofluorescent stainings for α-actinin (green) and troponin T (red) of antibiotic selected and Nkx2.5 programmed cells at day 25 of differentiation. Nuclei are stained with DAPI (blue). Almost all cells in the culture are double-positive for the cardiac markers. (G) Representative immunoflourescent images of Nkx2.5 programmed cells, showing well-organized sarcomere structures.